

Data dashboards
welcome to the data dashboard page, here were going to explore the real graphs, tables and statistics that display all the crucial information for each company, including the yearly revenue. campaigns, sales and the before and after overview so you can grasp the key concepts behind each strategie and impact of social media marketing all the data is from recent years to ensure relevant data
SPOTIFY
Spotify reports on a calendar-year basis. Its 2024 annual report gives a clean three-year comparable series and separates Premium revenue from advertising-supported revenue.
Spotify's 2024 revenue reached €15.673bn, up 18% from 2023. The company also recorded its first full year of profitability in 2024. This provides a strong financial endpoint for comparing the growth of users and the role of digital marketing.

Spotify Wrapped is the strongest campaign for this project because it turns each user's own listening data into personalised content designed to be shared. The campaign therefore creates a large amount of user-generated distribution rather than relying only on Spotify's official social accounts.
.
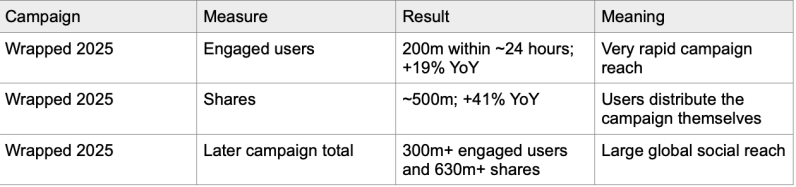
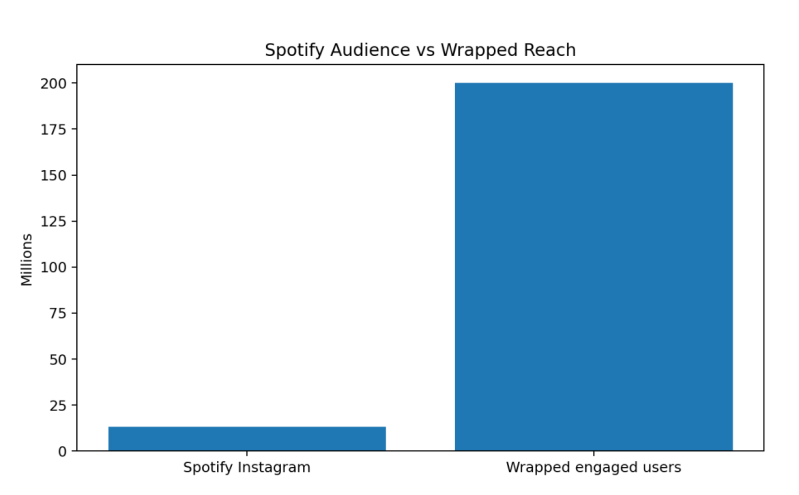
A key analytical point is that followers are not the same as campaign reach. Spotify's official Instagram audience is only around 13.3m, yet Wrapped reached 200m engaged users in roughly 24 hours in 2025. The campaign therefore spreads through users' own accounts, creating user-generated distribution.

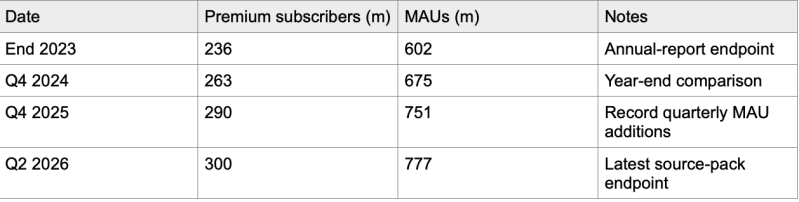
For Spotify, Premium subscribers are the closest equivalent to paying customers/sales demand, while Monthly Active Users (MAUs) show total platform demand. These are stronger measures for this company than trying to estimate physical sales.
Befroe/after
Spotify's sales and marketing expense declined from €1.572bn in 2022 to €1.392bn in 2024 while revenue rose from €11.727bn to €15.673bn. At the same time, operating income changed from a €659m loss in 2022 to €1.365bn positive income in 2024. This does not prove that social media caused profitability, but it provides useful evidence for discussing marketing efficiency alongside growth.

GYMSHARK
Gymshark's group revenue increased every year in the four-year series used in this research: from £484.5m in FY2022 to £647.3m in FY2025. That is an overall increase of about 33.6%. Growth slowed from 14.8% in FY2023 to 9.2% in FY2024 and 6.6% in FY2025, but the company still recorded its thirteenth consecutive year of growth in FY2025.

E -commerce

Direct-to-consumer (D2C) and e-commerce are central to Gymshark's business model. D2C revenue increased from £481.3m in FY2022 to £612.0m in FY2025. In FY2025, D2C/e-commerce represented approximately 94.5% of total group revenue, showing how strongly the company remains connected to online purchasing.
social media followers
Wij zijn een toegewijd team dat zich inzet om uitzonderlijke ervaringen te creëren. Onze focus ligt op het leveren van betrouwbare en innovatieve oplossingen, gedreven door respect voor kwaliteit en een oprechte wens om verwachtingen te overtreffen.

Before and after financial performance

Gymshark provides a strong before/after story because its early growth model was heavily based on social media and influencers. In 2020, Forbes reported that the company had about 80 paid fitness influencers, revenue of approximately $330m and a valuation above $1.4bn. By FY2025, the group reported £647.3m of revenue. The evidence supports a strong association between the company's community-led digital strategy and its growth, but it does not prove that social media alone caused every increase.
Nike
Nike's fiscal year ends on 31 May. The comparable series below shows revenue increasing through FY2024, then falling sharply in FY2025 and remaining essentially flat in FY2026.

Online engagement

audience size and engagement are different measures. Nike's Instagram audience is enormous, but the source pack reports a much lower engagement rate than the smaller Gymshark audience. This allows the project to compare reach with actual interaction rather than treating followers as the same as engagement.

social media campaigns and finance comparisons

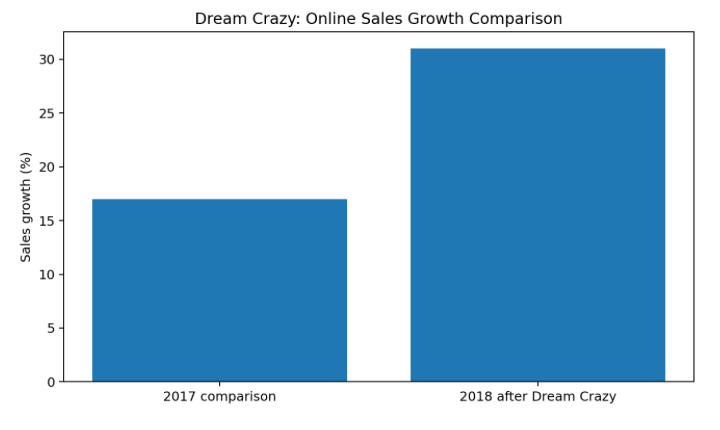
Nike provides evidence that social and digital marketing can create short-term attention and demand, but the relationship with long-term revenue is not automatic. Dream Crazy is a strong before/after case because online sales rose from a 17% comparison-period growth rate to 31% after the launch, while the wider financial data show that Nike later experienced a major revenue decline. This makes Nike valuable for the project because it demonstrates both the potential influence of social media and the limits of claiming direct causation.
.
Sales jump
This graph represent the extreme difference in sales a year and after before the 2018 dream crazy campaign, displaying the exponential growth in sales online. This illustrated the biggest jump out of all campaigns Nike initiated increasing the brands popularity known today
Ontdek onze producten
Onze zorgvuldig samengestelde collectie producten is ontworpen om te voldoen aan jouw specifieke behoeften en voorkeuren. Elk product in onze collectie vertegenwoordigt onze toewijding aan kwaliteit, functionaliteit en stijl. Bekijk ons aanbod en vind gedetailleerde beschrijvingen, functies en specificaties waarmee je weloverwogen keuzes kunt maken. Of je nu op zoek bent naar dagelijkse benodigdheden, gespecialiseerde artikelen of iets unieks, wij hebben voor elke smaak en behoefte iets in huis.
research focus
The research focused on five key areas:
-
Revenue growth and financial performance.
-
Successful social media marketing campaigns.
-
Social media engagement and audience growth.
-
Sales, subscriptions and e-commerce performance.
-
Changes in financial performance before and after major campaigns.
By comparing these areas, it became possible to identify patterns between a company's online presence, marketing strategies and financial success.
Maak jouw eigen website met JouwWeb